Social Performance Data

ESG Data Collection
Social Performance Data (FY2024)
Number of employees (FY2024)
| Item | Number of employees | Number of Temporary employees | Temporary staffing | Total Number of employees | |
|---|---|---|---|---|---|
| Domestic total (persons) | 5,252 | 1,123 | 1,394 | 7,769 | |
| Overseas total (persons) | 20,365 | 1,134 | 2,141 | 23,640 | |
| Americas | 6,065 | 553 | 1 | 6,619 | |
| Asia | 10,386 | 409 | 1,747 | 12,542 | |
| Europe | 3,274 | 13 | 245 | 3,532 | |
| Other | 640 | 159 | 148 | 947 | |
| Sumitomo Riko Group total (persons) | 25,617 | 2,257 | 3,535 | 31,409 | |
Employee Composition by Age Group
| Item | FY 2022 | FY 2023 | FY 2024 | |||
|---|---|---|---|---|---|---|
| Male | Female | Male | Female | Male | Female | |
| Under 30 years old (persons) | 446 | 128 | 514 | 148 | 463 | 149 |
| 30 to 39 years old (persons) | 810 | 163 | 818 | 159 | 814 | 160 |
| 40 to 49 years old (persons) | 863 | 222 | 858 | 221 | 853 | 204 |
| 50 to 59 years old (persons) | 949 | 94 | 850 | 92 | 924 | 141 |
| 60 years old or older (persons) | 5 | 0 | 0 | 0 | 5 | 0 |
| Total (persons) | 3,073 | 607 | 3,040 | 620 | 3,059 | 654 |
*Data covers regular employees of Sumitomo Riko (including those seconded to other companies).
New Hires and Leavers
| Item | FY 2022 | FY 2023 | FY 2024 | |||
|---|---|---|---|---|---|---|
| Male | Female | Male | Female | Male | Female | |
| Number of New Hires (persons) | 102 | 20 | 125 | 30 | 179 | 42 |
| Percentage of New Hires (%) | 3.3% | 3.3% | 4.1% | 4.8% | 5.9% | 6.4% |
| Number of employees leaving for personal reasons (people) | 89 | 22 | 88 | 26 | 64 | 22 |
| Ratio of employees leaving for personal reasons (%) | 2.9% | 3.6% | 2.9% | 3.5% | 2.1% | 3.4% |
*The figures are for Sumitomo Riko alone.
Mid-Career Recruitment Rate
| Item | FY 2022 | FY 2023 | FY 2024 |
|---|---|---|---|
| Mid-Career Recruitment Rate (%) | 49 | 30 | 31 |
*The figures are for Sumitomo Riko alone.
Ratio of Female Managers
| Item | FY 2022 | FY 2023 | FY 2024 |
|---|---|---|---|
| Sumitomo Riko | 8 persons | 7 persons | 13 persons |
| 1.4% | 1.3% | 2.3% | |
| Global (including consolidated companies) |
41 persons | 249 persons | 250 persons |
| 9.3% | 14.7% | 14.7% |
*Number of key personnel for Sumitomo Riko. As for Global, General Managers and above in FY2021 and FY2022, and Section Managers and above in FY2023 and thereafter.
Employment Rate of People with Disabilities
| Item | FY 2022 | FY 2023 | FY 2024 |
|---|---|---|---|
| Percentage of employees with disabilities (%) | 2.66 | 2.70 | 2.77 |
*The percentage of employees with disabilities is calculated for the Group (Sumitomo Riko, SumiRiko Joyful, and SumiRiko Creates).
Annual paid leave
| Item | FY 2022 | FY 2023 | FY 2024 |
|---|---|---|---|
| Average annual number of days of paid leave (days) | 16.0 | 16.4 | 15.8 |
*Figures are for Sumitomo Riko only
Total Labor Hours
| Item | FY 2022 | FY 2023 | FY 2024 |
|---|---|---|---|
| Total Labor Hours (average per capita) | 1,964 | 1,980 | 1,982 |
*Figures are for Sumitomo Riko only
Differences in wages between male and female workers
| Item | FY 2024 | ||
|---|---|---|---|
| Regular workers | Non-regular workers | All workers | |
| Sumitomo Riko | 65.9% | 70.2% | 65.0% |
Status of System Utilization
Support for Childcare
| Program | FY 2022 | FY 2023 | FY 2024 |
|---|---|---|---|
| On-Site Daycare Center (persons) | 37 | 34 | 26 |
| Percentage of employees taking childcare leave, etc. | Male:21% | Male:50% | Male:68% |
| Female:100% | Female:100% | Female:100% | |
| Percentage of employees taking childcare leave, etc. and leave for childcare purposes | Male:87% | Male:85% | Male:88% |
| Female:100% | Female:100% | Female:100% | |
| Shortened Working Hours / Shorter-Hours Flextime (persons) | 68 | 66 | 75 |
| Flextime for childcare (persons) | 71 | 57 | 54 |
| Child nursing leave (persons) | 26 | 32 | 26 |
| Childcare incentive leave (persons) | 43 | 39 | 42 |
*For "Percentage of employees taking childcare leave, etc." and "Percentage of employees taking childcare leave, etc. and leave for childcare purposes," the subjects are direct employees of Sumitomo Riko (including those seconded to other companies).
The figures other than the above exclude employees on secondment to other companies.
The figures other than the above exclude employees on secondment to other companies.
Support for nursing care (available for employees with a family member certified nursing care need).
| Item | FY 2022 | FY 2023 | FY 2024 |
|---|---|---|---|
| Nursing Care Leave (persons) | 4 | 4 | 5 |
| Shortened Working Hours and Shorter-Hours Flextime (persons) | 5 | 4 | 3 |
| Short-term nursing care leave (persons) | 4 | 7 | 11 |
| Nursing Care Flextime (persons) | 3 | 3 | 2 |
*Data covers employees who are directly employed by Sumitomo Riko (excluding those seconded to other companies).
Number of Sumitomo Riko Labor Union members
| Item | FY 2022 | FY 2023 | FY 2024 |
|---|---|---|---|
| Number of Union Members/Total Number of Employees (people) | 2,927/3,680 | 2,924/3,661 | 2,965/3,713 |
*Data covers regular employees of Sumitomo Riko (including those seconded to other companies, as of the end of each fiscal year).
*Labor unions belong to the All Japan Federation of Rubber Workers Unions, etc.
*Labor unions belong to the All Japan Federation of Rubber Workers Unions, etc.
Number of Participants in Human Resource Development Programs (FY2024)
| Item | Basic and Regular Training | Training by Job Level | Training by Needs | Total |
|---|---|---|---|---|
| Number of Participants (persons) | 69 | 2,191 | 185 | 2,445 |
*Data covers Sumitomo Riko and domestic group companies.
Training Hours
| Item | FY 2022 | FY 2023 | FY 2024 |
|---|---|---|---|
| Hours of training per employee (hours) | 5.4 | 8.2 | 9.0 |
*This figure is for Sumitomo Riko. (Calculated as total training hours per year divided by the number of non-consolidated employees of Sumitomo Riko as of the end of the relevant fiscal year)
Social Contribution Expenditure
| Item | FY 2022 | FY 2023 | FY 2024 |
|---|---|---|---|
| Total Expenditures (million yen) | 54 | 67 | 222 |
| Of which, total amount Donations (million yen) | 40 | 49 | 83 |
*Data for FY2022 and FY2023 are for Sumitomo Riko on a non-consolidated basis.
*Data for FY2024 are for the Sumitomo Riko Group (consolidated).
*Data for FY2024 are for the Sumitomo Riko Group (consolidated).
Occupational Accident Occurrence
| Item | FY 2022 | FY 2023 | FY 2024 | |
|---|---|---|---|---|
| Number of serious accidents | Domestic Group | 0 | 0 | 0 |
| Overseas Group | 0 | 0 | 0 | |
| Total | 0 | 0 | 0 | |
| Number of lost time accident | Domestic Group | 0 | 0 | 3 |
| Overseas Group | 2 | 3 | 3 | |
| Total | 2 | 3 | 6 | |
*Serious Occupational Accidents: Fatal Accidents are covered.
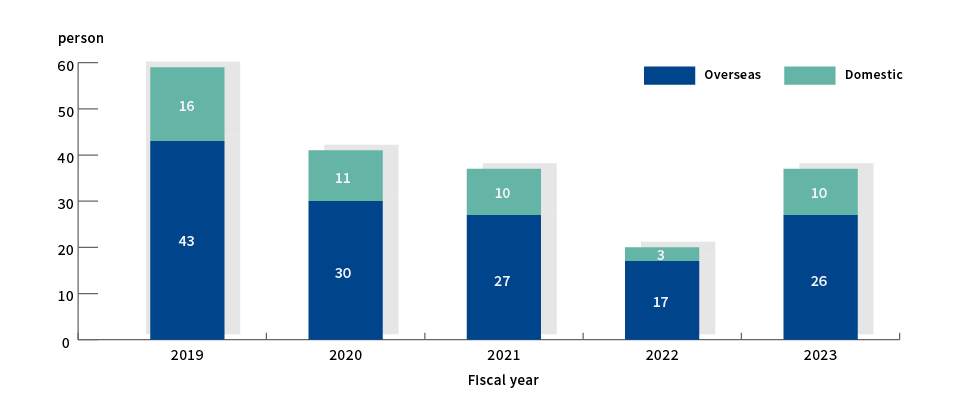
Number of Workers injured in Industrial Accidents
Frequency Rate of Lost Worktime due to Industrial accidents
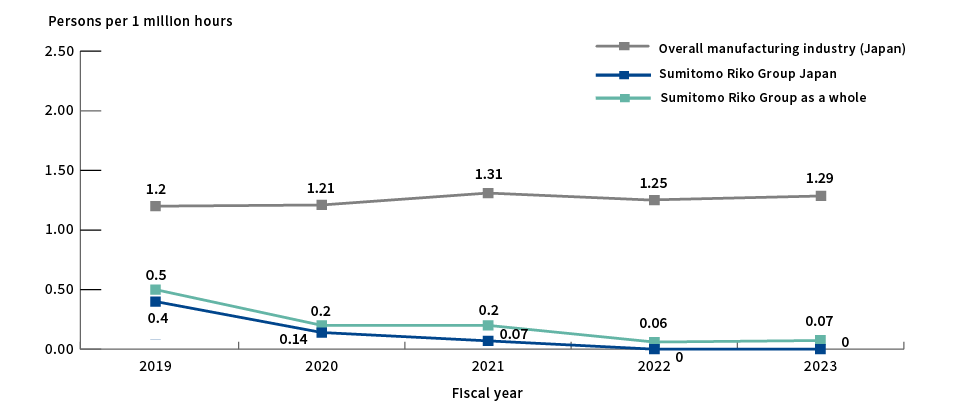
*Lost worktime injury frequency rate...Number of lost worktime injuries per million total working hours
*Data for the manufacturing industry (Japan) is from the Ministry of Health, Labour and Welfare's Occupational Accident Statistics.
*Data for the manufacturing industry (Japan) is from the Ministry of Health, Labour and Welfare's Occupational Accident Statistics.
Health Policy Indicators
| Item | FY 2022 Results |
FY 2023 Results |
FY 2024 Results |
FY 2025 Targets |
|---|---|---|---|---|
| Presenteeism*1*4 | - | - | 77.4% | 80% |
| Absenteeism -Rate of days lost from work due to illness (overall)*2*4 | 0.65 | 0.59 | 0.72 | 0.45 |
| Absenteeism -Rate of days lost from work due to illness (for mental health reasons)*2 |
0.46 | 0.46 | 0.57 | 0.27 |
| Percentage of those who took leave due to mental illness (for one month or longer) |
1.3% | 1.3% | 1.1% | Less than 1% |
| Work engagement*3*4 | 2.26 | 2.32 | 2.38 | 2.5 |
| Percentage of high-stress workplaces (overall health risk 120 or more) |
8.1% | 8.2% | 4.5% | Less than 2% |
| Percentage of high-stress workplaces (overall health risk 150 or more) |
1.2% | 0.8% | 0.7% | 0% |
| Percentage of employees maintaining an appropriate weight (BMI 18.5–24.9) |
66.1% | 66.5% | 65.6% | 70.0% |
| Percentage of those who are at risk of hypertension (systolic blood pressure of 160mmHg or higher) |
2.9% | 2.3% | 1.7% | 2.0% |
| Percentage of those who are at risk of hyperglycemia (fasting blood sugar of 200 or more or HbA1c of 8.0 or more) |
0.6% | 0.8% | 0.4% | 0.5% |
| Percentage of those who are at risk of low liver function (AST or ALT of 100 or more) |
1.3% | 1.4% | 1.2% | 1.0% |
| Percentage of those who smoke | 28.9% | 27.8% | 27.4% | Less than 20% |
| Routine exercise (percentage of those who exercise twice a week and for at least 30 minutes or more each time) |
24.4% | 24.7% | 25.2% | 30% or more |
| Skipping breakfast (percentage of those who skip breakfast less than three times a week) |
75.9% | 75.9% | 75.3% | 80% |
| Sleep (percentage of those who get enough sleep) | 64.3% | 65.2% | 63.2% | 70% |
| Alcohol consumption (percentage of those who drink less than 1 standard drink per day) |
64.2% | 67.2% | 58.1% | 70% |
| Those to whom three or more of the five items above apply*4 *5 | 70.5% | 70.2% | 67.3% | 75% |
| Those to whom four or more of the five items above apply | 35.5% | 36.8% | 32.6% | 40% |
| Those to whom five of the five items above apply | 6.7% | 7.1% | 6.1% | 8.0% |
| Percentage of registrations for the health promotion apps (Pep Up) |
33.2% | 35.3% | 36.5% | 45% |
| Number of participants in training on health improvement | 3,266 | 5,098 | 5,291 | 3,000 or more |
| Rate of participation in walking events | 14.6% | 14.1% | 18.2% | 20% |
| Response rate of stress checks | 94.2% | 96% | 97.3% | 95% |
| Rate of regular health checkups gotten | 100% | 100% | 100% | 100% |
| Rate of colorectal cancer screening tests taken | - | 85% | 84% | 85% |
| Examination rate for those who need retesting | - | 87.4% | 87.7% | 80% |
| Rate of employees receiving health guidance | - | 80.6% | 93.9% | 80% |
*1 Presenteeism...measured by SPQ (University of Tokyo 1-item version) FY2025 results: 78.2% (survey began in FY2024)
*2 Absenteeism...Rate of days away from work due to illness [%]=Number of days away from work due to illness [days]/(Average number of employees [persons] x Prescribed working days [days])
*3 Work engagement...Calculated as the average of two items related to pride and vitality at work on a 4-point scale.
*4 Presenteeism and work engagement...3,983 persons measured, response rate 97.3% (FY2025)
Absenteeism...3,924 persons measured, 100% response rate (FY2024)
*5 Number of items that cleared the following: no smoking, exercise habit, no breakfast missing, rested by sleep, and appropriate drinking habit.
Related information
Investment Amount in Employee Health
| Items Invested in/Details | Cost Estimate* | |
|---|---|---|
| Health Investment Implementation System | Health Care System Maintenance | 1,200 |
| Health Checkups | 60,000 | |
| Stress Checks | 2,400 | |
| Support for Employees Traveling Overseas | 10,000 | |
| Measures to Prevent Infectious Diseases | 3,500 | |
| Health Support Center Renovation | 15,000 | |
| Individual Support | Support and Individual Support, from External Experts/Specialist Institutions | 4,000 |
| Costs in Health Education | Conducting Seminars, etc. | 1,000 |
Related information