Social Performance Data
ESG Data Collection
Social Performance Data (FY2023)
Number of employees (FY2023)
| Item | Number of employees | Number of Temporary employees | Temporary staffing | Total Number of employees | |
|---|---|---|---|---|---|
| Domestic total (persons) | 5,251 | 1,037 | 1,443 | 7,731 | |
| Overseas total (persons) | 20,441 | 1,175 | 2,953 | 24,569 | |
| Americas | 5,593 | 650 | 0 | 6,243 | |
| Asia | 10,858 | 385 | 2,517 | 13,760 | |
| Europe | 3,416 | 10 | 313 | 3,739 | |
| Other | 574 | 130 | 123 | 827 | |
| Sumitomo Riko Group total (persons) | 25,692 | 2,212 | 4,396 | 32,300 | |
Employee Composition by Age Group
| Item | FY 2021 | FY 2022 | FY 2023 | |||
|---|---|---|---|---|---|---|
| Male | Female | Male | Female | Male | Female | |
| Under 30 years old (persons) | 451 | 136 | 446 | 128 | 514 | 148 |
| 30 to 50 years old (persons) | 1,803 | 396 | 1,681 | 385 | 1,764 | 402 |
| 51 years old or older (persons) | 844 | 60 | 946 | 94 | 762 | 70 |
| Total (persons) | 3,098 | 592 | 3,073 | 607 | 3,040 | 620 |
*Data covers regular employees of Sumitomo Riko (including those seconded to other companies).
New Hires and Leavers
| Item | FY 2021 | FY 2022 | FY 2023 | |||
|---|---|---|---|---|---|---|
| Male | Female | Male | Female | Male | Female | |
| Number of New Hires (persons) | 63 | 17 | 102 | 20 | 125 | 30 |
| Percentage of New Hires (%) | 2.0% | 2.9% | 3.3% | 3.3% | 4.1% | 4.8% |
| Number of employees leaving for personal reasons (people) | 72 | 21 | 105 | 22 | 123 | 32 |
| Ratio of employees leaving for personal reasons (%) | 2.3% | 3.5% | 3.4% | 3.6% | 4.0% | 5.2% |
*The figures are for Sumitomo Riko alone.
Mid-Career Recruitment Rate
| Item | FY 2021 | FY 2022 | FY 2023 |
|---|---|---|---|
| Mid-Career Recruitment Rate (%) | 22 | 49 | 30 |
*The figures are for Sumitomo Riko alone.
Ratio of Female Managers
| Item | FY 2021 | FY 2022 | FY 2023 |
|---|---|---|---|
| Sumitomo Riko | 8 persons | 8 persons | 7 persons |
| 1.4% | 1.4% | 1.3% | |
| Global (including consolidated companies) | 40 persons | 41 persons | 249 persons |
| 9.0% | 9.3% | 14.7% |
*Sumitomo Riko: Number of key personnel
Global (including consolidated subsidiaries): Number of general managers and above in FY2021 and FY2022; Number of managers and above in FY2023.
Employment Rate of People with Disabilities
| Item | FY 2021 | FY 2022 | FY 2023 |
|---|---|---|---|
| Percentage of employees with disabilities (%) | 2.51 | 2.66 | 2.70 |
*The percentage of employees with disabilities is calculated for the Group (Sumitomo Riko, SumiRiko Joyful, and SumiRiko Creates).
Annual paid leave
| Item | FY 2021 | FY 2022 | FY 2023 |
|---|---|---|---|
| Average annual number of days of paid leave (days) | 15.2 | 16.0 | 16.4 |
*Figures are for Sumitomo Riko only
Total Labor Hours
| Item | FY 2021 | FY 2022 | FY 2023 |
|---|---|---|---|
| Total Labor Hours (average per capita) | 2,028 | 1,964 | 1,980 |
*Figures are for Sumitomo Riko only
Differences in wages between male and female workers
| FY 2023 | |||
|---|---|---|---|
| Regular workers | Non-regular workers | All workers | |
| Sumitomo Riko | 64.6% | 76.6% | 63.9% |
| Sumitomo Riko Hosetex, Ltd. | 82.5% | 59.4% | 79.7% |
| SumiRiko Oita Advanced Elastomer Company Limited | - | - | - |
| SumiRiko Kyushu Company Limited | - | - | - |
| Tokai Chemical Industries, Ltd. | 71.9% | 82.4% | 70.1% |
Status of System Utilization
Support for Childcare
| Program | FY 2021 | FY 2022 | FY 2023 |
|---|---|---|---|
| On-Site Daycare Center (persons) | 35 | 37 | 34 |
| Percentage of employees taking childcare leave, etc. | Male : 8% | Male : 21% | Male : 50% |
| Female : 100% | Female : 100% | Female : 100% | |
| Percentage of employees taking childcare leave, etc. and leave for childcare purposes | Male : 74% | Male : 87% | Male : 85% |
| Female : 100% | Female : 100% | Female : 100% | |
| Shortened Working Hours / Shorter-Hours Flextime (persons) | 55 | 68 | 66 |
| Flextime for childcare (persons) | 77 | 71 | 57 |
| Child nursing leave (persons) | 18 | 26 | 32 |
| Childcare incentive leave (persons) | 51 | 43 | 39 |
*Data covers employees who are directly employed by Sumitomo Riko (excluding those seconded to other companies).
Support for nursing care (available for employees with a family member certified nursing care need).
| Item | FY 2021 | FY 2022 | FY 2023 |
|---|---|---|---|
| Nursing Care Leave (persons) | 2 | 4 | 4 |
| Shortened Working Hours and Shorter-Hours Flextime (persons) | 3 | 5 | 4 |
| Short-term nursing care leave (persons) | 6 | 4 | 7 |
| Nursing Care Flextime (persons) | 7 | 3 | 3 |
| Use of Professional Consultation Service (cases) | 2 | 1 | 2 |
*Data covers employees who are directly employed by Sumitomo Riko (excluding those seconded to other companies).
Number of Sumitomo Riko Labor Union members
| Item | FY 2021 | FY 2022 | FY 2023 |
|---|---|---|---|
| Number of Union Members/Total Number of Employees (people) | 2,958/3,690 | 2,927/3,680 | 2,924/3,661 |
*Data covers regular employees of Sumitomo Riko (including those seconded to other companies, as of the end of each fiscal year).
*Labor unions belong to the All Japan Federation of Rubber Workers Unions, etc.
*Labor unions belong to the All Japan Federation of Rubber Workers Unions, etc.
Number of Participants in Human Resource Development Programs (FY2023)
| Item | Basic and Regular Training | Training by Job Level | Training by Needs | Total |
|---|---|---|---|---|
| Number of Participants (persons) | 78 | 1,703 | 45 | 1,826 |
*Data covers Sumitomo Riko and domestic group companies.
Training Hours
| Item | FY 2021 | FY 2022 | FY 2023 |
|---|---|---|---|
| Hours of training per employee (hours) | 4.9 | 5.4 | 8.2 |
*This figure is for Sumitomo Riko. (Calculated as total training hours per year divided by the number of non-consolidated employees of Sumitomo Riko as of the end of the relevant fiscal year)
Social Contribution Expenditure
| Item | FY 2021 | FY 2022 | FY 2023 |
|---|---|---|---|
| Total Expenditures (million yen) | 28 | 54 | 67 |
| Of which, total amount Donations (million yen) | 15 | 40 | 49 |
※The figures are for Sumitomo Riko alone.
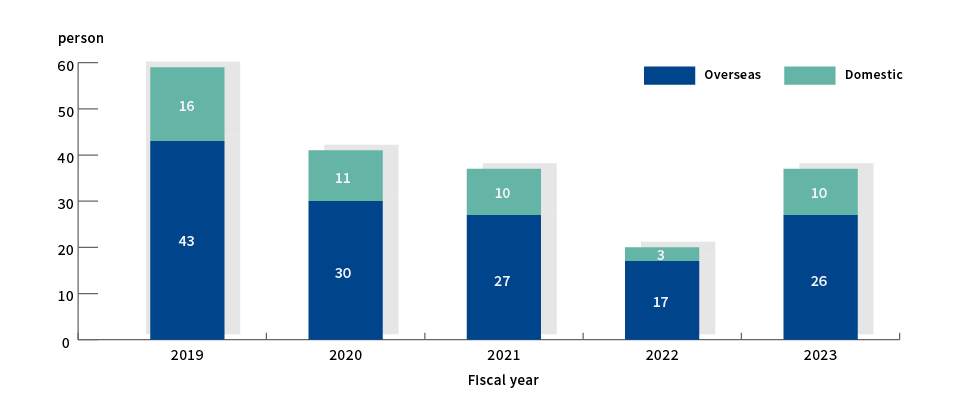
Number of Workers injured in Industrial Accidents

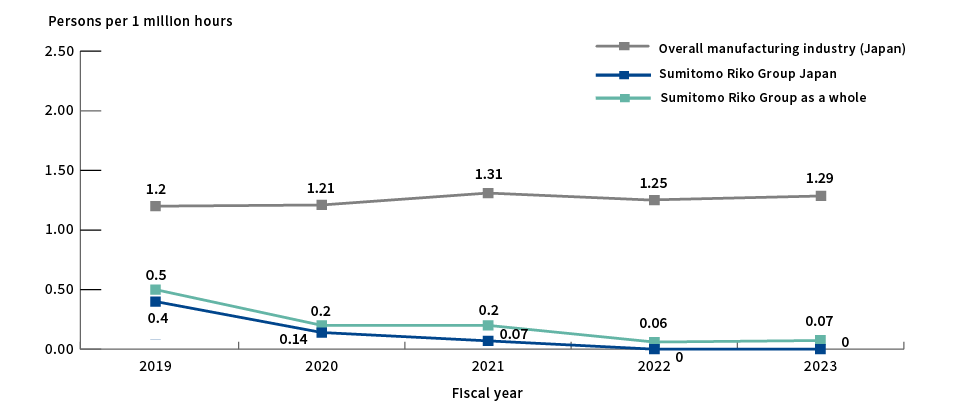
Frequency Rate of Lost Worktime due to Industrial accidents

*Lost worktime injury frequency rate...Number of lost worktime injuries per million total working hours
*Data for the manufacturing industry (Japan) is from the Ministry of Health, Labour and Welfare's Occupational Accident Statistics.
*Data for the manufacturing industry (Japan) is from the Ministry of Health, Labour and Welfare's Occupational Accident Statistics.
Health Policy Indicators
| Item | FY 2021 | FY 2022 | FY 2023 | FY 2025 Target |
|---|---|---|---|---|
| Presenteeism*1 | - | - | - | 80% |
| Absenteeism -Rate of days lost from work due to illness (overall)*2 | 0.54 | 0.65 | 0.59 | 0.45 |
| Absenteeism -Rate of days lost from work due to illness (for mental health reasons)*2 |
0.42 | 0.46 | 0.46 | 0.27 |
| Percentage of those who took leave due to mental illness (for one month or longer) |
0.97% | 1.3% | 1.3% | Less than 1% |
| Work engagement*3 | 2.26 | 2.26 | 2.32 | 2.5 |
| Percentage of high-stress workplaces (overall health risk 120 or more) |
10.8% | 8.1% | 8.2% | Less than 2% |
| Percentage of high-stress workplaces (overall health risk 150 or more) |
2.4% | 1.2% | 0.8% | 0% |
| Percentage of employees maintaining an appropriate weight (BMI 18.5–24.9) |
65.8% | 66.1% | 66.5% | 70.0% |
| Percentage of those who are at risk of hypertension (systolic blood pressure of 160mmHg or higher) |
2.2% | 2.9% | 2.3% | 2.0% |
| Percentage of those who are at risk of hyperglycemia (fasting blood sugar of 200 or more or HbA1c of 8.0 or more) |
0.7% | 0.6% | 0.8% | 0.5% |
| Percentage of those who are at risk of low liver function (AST or ALT of 100 or more) |
1.4% | 1.3% | 1.4% | 1.0% |
| Percentage of those who smoke | 29.9% | 28.9% | 27.8% | Less than 20% |
| Routine exercise (percentage of those who exercise twice a week and for at least 30 minutes or more each time) |
22.5% | 24.4% | 24.7% | 30% or more |
| Skipping breakfast (percentage of those who skip breakfast less than three times a week) |
75.6% | 75.9% | 75.9% | 80% |
| Sleep (percentage of those who get enough sleep) | 63.3% | 64.3% | 65.2% | 70% |
| Alcohol consumption (percentage of those who drink less than 1 standard drink per day) |
67.6% | 64.2% | 67.2% | 70% |
| Those to whom three or more of the five items above apply*5 | 68.7% | 70.5% | 70.2% | 75% |
| Those to whom four or more of the five items above apply | 34.9% | 35.5% | 36.8% | 40% |
| Those to whom five of the five items above apply | 6.3% | 6.7% | 7.1% | 8.0% |
| Percentage of registrations for the health promotion apps (Pep Up) |
30.3% | 33.2% | 35.3% | 45% |
| Number of participants in training on health improvement | 2,237 | 3,266 | 5,098 | 3,000 or more |
| Rate of participation in walking events | 12.2% | 14.6% | 14.1% | 20% |
| Response rate of stress checks | 92.4% | 94.2% | 96% | 95% |
| Rate of regular health checkups gotten | 100% | 100% | 100% | 100% |
| Rate of colorectal cancer screening tests taken | - | - | 85% | 85% |
| Examination rate for those who need retesting | - | - | 87.4% | 80% |
| Rate of employees receiving health guidance | - | - | 80.6% | 80% |
*1 Presenteeism...Measured by SPQ (University of Tokyo 1-item version) FY2024 results: 77.4% (survey started in FY2024)
*2 Absenteeism...Rate of days away from work due to illness [%]=Number of days away from work due to illness [days]/(Average number of employees [persons] x Prescribed working days [days])
*3 Work engagement...Calculated as the average of two items related to pride and vitality at work on a 4-point scale.
*4 Presenteeism and work engagement...3,871 persons measured, response rate 97.3% (FY2024)
Absenteeism...3,915 persons measured, 100% response rate (FY2023)
*5 Number of items that cleared the following: no smoking, exercise habit, no breakfast missing, rested by sleep, and appropriate drinking habit.
Related information
Investment Amount in Employee Health
| Items Invested in/Details | Cost Estimate* | |
|---|---|---|
| Health Investment Implementation System | Health Care System Maintenance | 1,200 |
| Health Checkups | 53,800 | |
| Stress Checks | 2,400 | |
| Support for Employees Traveling Overseas | 8,100 | |
| Measures to Prevent Infectious Diseases | 3,600 | |
| Health Support Center Renovation | 15,000 | |
| Individual Support | Support and Individual Support, from External Experts/Specialist Institutions | 4,000 |
| Costs in Health Education | Conducting Seminars, etc. | 1,000 |
Related information


